Is there actually a Sydney bias? Should there be a finals series? Are the Mariners really as crap as everyone thinks? How many passes did the Wanderers make in the final third after the 84th minute mark? At FTBL, we answer the big questions.
DOES THE SALARY CAP MATTER?
Another interesting statistic compares the passes to shots ratio, with Western Sydney managing to fire off the second most shots with the second least passes in the build-up.
It's a sign that the A-League, despite its agricultural reputation among the wider public, is a league that vastly rewards a calm, measured build-up.
This is still thrown out a little by Sydney's success under Corica's slightly more direct style however and both Melbourne Victory and Sydney's success against Perth by remaining defensively solid and playing counter-attacking football.
But ultimately what these stats tell us is that while the salary cap certainly pushes towards equality, the A-league certainly has big guns: the best teams attempting to dominate and the weaker attempting to counter.
Passes
|
1 |
Melbourne Victory |
14,977 |
|
2 |
Perth Glory |
14,850 |
|
3 |
Sydney FC |
14,169 |
|
4 |
Melbourne City FC |
14,057 |
|
5 |
Adelaide United |
13,378 |
|
6 |
Wellington Phoenix |
11,447 |
|
7 |
Newcastle Jets |
11,236 |
|
8 |
Brisbane Roar FC |
10,812 |
|
9 |
Western Sydney Wanderers FC |
10,768 |
|
10 |
Central Coast Mariners |
9,731 |
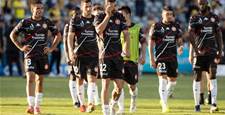
MELBOURNE CITY'S FRUSTRATION
Proving City fans' frustration is while their side had one of the lowest shot ratios in the competition, they still had one of the highest pass completion and accuracy ratings. A lot of side-to-side then backwards at AAMI Park then.
This table also highlights one of the subtle ways in which Steve Corcia diverged from Graham Arnold's style, with Corica's Sydney outfit forcing the play earlier and relying on a more direct, quicker style, much to their success.
Passing Accuracy
|
1 |
Perth Glory |
81% |
|
2= |
Melbourne City FC |
80% |
|
2= |
Melbourne Victory |
80% |
|
4= |
Adelaide United |
79% |
|
4= |
Sydney FC |
79% |
|
6 |
Western Sydney Wanderers FC |
77% |
|
7 |
Wellington Phoenix |
76% |
|
8= |
Brisbane Roar FC |
75% |
|
8= |
Newcastle Jets |
75% |
|
10 |
Central Coast Mariners |
72% |
Related Articles

Socceroo-in-waiting seals Championship deal

Fringe Socceroo swerves A-League to remain in Europe after Fulham exit